What I Learned Building Web Dashboards with React and Next.js
Posted on : 09-08-2025 | 4 min reading time
Written by Bhavana K Gowda

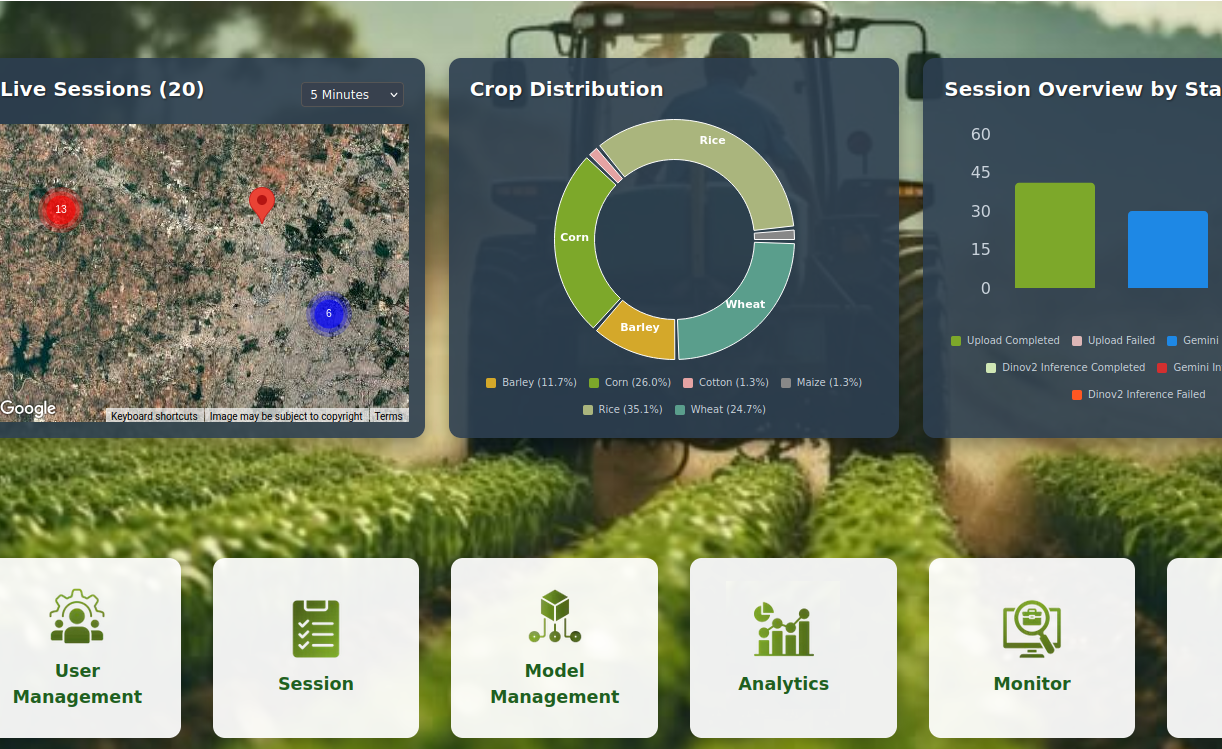
Building a Better Control Panel Simple Way to Think About Web Dashboards
Building a web dashboard is a lot like building the control panel for a spaceship. You need clear dials, fast screens, and a solid plan that connects all the wiring. For modern web dashboards, I’ve found the best "screens and dials" are made with React.js, and the best "wiring plan" comes from Next.js.
I want to share the simple lessons I’ve learned using these tools to build dashboards that are fast, clear, and easy to use.
Part 1: React.js - Like Building with Smart Lego Blocks
First, let's talk about React. The best way to think of React is that it lets you build your web dashboard with smart Lego blocks.
Instead of one giant, messy screen, you build small, separate blocks for each part of your dashboard—a block for a sales chart, a block for a data table, and another for a filter button. Each block has its own job and can be used over and over again.
Lesson Learned: My first big lesson was this: build dashboards with blocks! It makes even the most complex screens feel simple and organized. If a chart needs an update, you just work on that one block, not the whole dashboard.
React also has a very clever helper that makes dashboards feel super fast. When a number changes, the helper instantly finds the one tiny spot on the screen that needs updating and changes only that. It doesn't redraw everything.
Lesson Learned: I learned to trust React's fast helper. My job is to design the charts and tables, and React does the hard work to make sure the dashboard feels quick and doesn't lag.
Part 2: Next.js - The Master Plan for Your Dashboard
React gives you the blocks, but it doesn't give you the instruction manual. That’s where Next.js comes in. Next.js provides the plan for how to put all the blocks together to build a strong, professional web dashboard.
Lesson Learned: My most important lesson was using Next.js to add structure. React is great for the individual components, but Next.js provides the expert plan needed to build a dashboard that is fast, secure, and well-organized.
This is where we get into how the page is shown to the user, and Next.js gives us a much smarter way to do it.
Handling the Data and Rendering
The Most Important Lesson: How Your Dashboard Gets Built
A web dashboard needs to show data. How it gets built and shown to the user is the most important factor in how fast it feels. There are two main ways to do this.
The Common Way: Client-Side Rendering This method has a technical name: Client-Side Rendering. "Client" just means the user's web browser. The browser gets a nearly empty page and has to do all the work of building (or "rendering") the charts and asking for the data itself. It's like being seated at a restaurant with an empty plate and having to call the waiter for everything. This is why you often see lots of loading spinners.
The Smart Next.js Way: Server-Side Rendering (SSR) This better way is called Server-Side Rendering (SSR). "Server" is the powerful company computer where your application lives. With SSR, the server does all the heavy lifting—it gets the data and builds the page before sending it to your browser. It’s like the waiter bringing your plate with the food already on it. The web dashboard appears full and ready to use instantly.
Lesson Learned: My biggest 'aha!' moment was understanding the difference between these two methods. Using Server-Side Rendering is a game-changer. It makes the dashboard feel faster and more professional from the very first second.
How We Actually "Talk" to the Data (API Implementation)
So how do we code these two different rendering methods?
The Code for Client-Side Rendering: In this model, a chart component uses a tool called fetch after it appears on the screen. It loads, then it fetches. This works, but it causes the loading spinners we want to avoid.
The Code for Server-Side Rendering: To do SSR, Next.js gives us a special function called getServerSideProps. We put our fetch code inside this function. Next.js runs this code on the server first, packing the data in before the page is sent. This is the key to an instant-loading dashboard.
The Next.js Superpower - Creating Your Own API:
Lesson Learned: The coolest lesson was realizing we could build our own simple APIs right inside Next.js by creating a file in a special pages/api folder. This keeps our front-end dashboard and our own simple back-end data source in the same project, making everything much easier to manage.
My Simple Rules for Building Great Web Dashboards Now
I now follow a few simple rules that have made all the difference.
React gives you the perfect building blocks for a dashboard (charts, tables, and cards).
Next.js provides the master plan to structure your dashboard and make it feel professional.
Choose your rendering method wisely. Use Server-Side Rendering (SSR) to make the first impression count and eliminate loading spinners.
Know where to ask for data. Use the special Next.js way (getServerSideProps) for that instant first load.
These principles help me build web dashboards that people find genuinely useful and pleasant to work with.
Recommended For You
A Farm with Zero Maintenance: The Ultimate Farmer’s Dream
Imagine a farm where the sun always shines, the soil hums with life, and crops grow effortlessly like magic.
Read more
Batteries in Flames or Farmers in Fields? The Truth About EVs and Seasonal Swings
the tales we tell about EV batteries—fiery monsters waiting to catch a spark or frozen blocks refusing to budge in winter.
Read more